

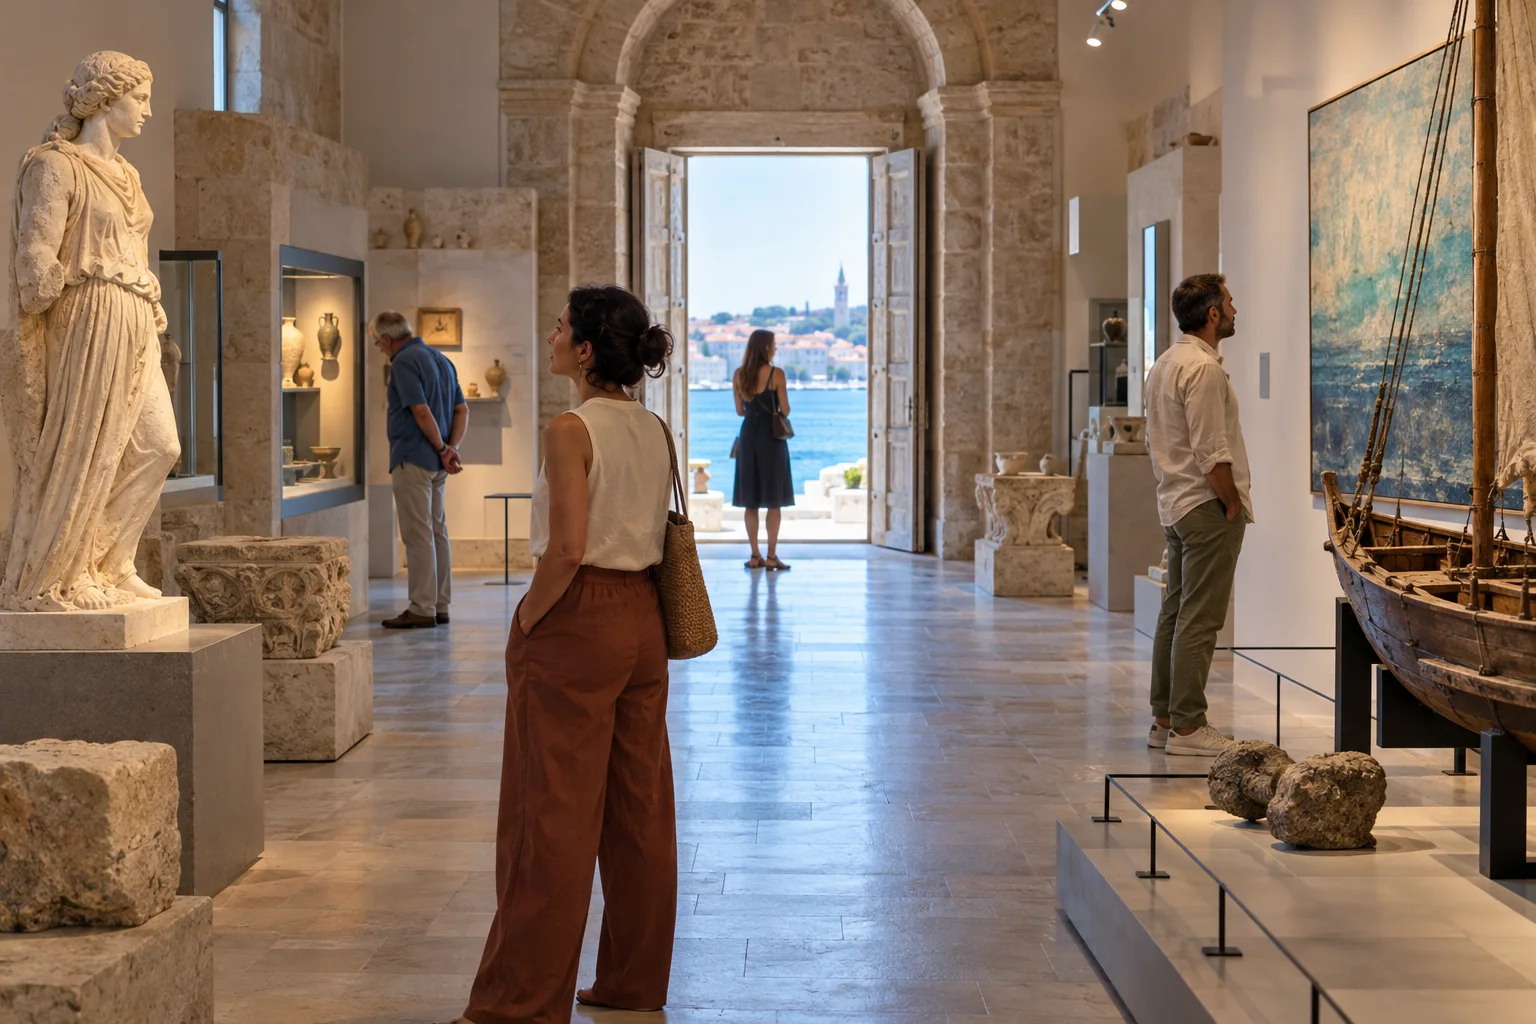
At the Adriatic, 8.8 per cent name culture as a reason for travelling, yet 15.1 per cent visit museums, galleries or exhibitions. The difference shows why a motivation question is not a visitor rate.
Why 8.8 per cent does not support a 90-per-cent headline
In the TOMAS Croatia 2022/2023 study, 8.8 per cent of surveyed Adriatic visitors named culture and art as a travel motivation. That does not mean the remaining 91.2 per cent ignore museums or pass culture by.
The motivation question allowed multiple answers and describes why someone travels. A person may come for the sea and nature, then still visit an exhibition, old town or historic site. Motivation and activity therefore have to be read separately.
15.1 per cent actually visited an exhibition
Among activities during the stay, 15.1 per cent of all respondents reported visiting a museum, gallery or exhibition. Historic buildings were visited by 16.6 per cent, while 40.0 per cent went sightseeing in towns and cities.
Those figures are not a complete inventory of culture either. A walk through a historic old town, a concert, a village festival or an archaeological landscape can be culturally significant without appearing in the museum line.
The coast, continental Croatia and Zagreb have different travel motivations
At the Adriatic, the sea dominates at 83.2 per cent and nature at 63.1 per cent. Culture and art reach 8.8 per cent there. In continental Croatia, the culture motivation stands at 13.4 per cent; for Zagreb, the study report gives about 23 per cent.
This is not a verdict on the quality of coastal museums. It mainly shows that a beach holiday is planned and described differently from a city break. The range of attractions, opening hours and visibility then help determine whether culture becomes part of the visitor's actual day.
Culture-motivated visitors use the offer more often
Among travellers whose main motivation was culture and art, 71.6 per cent visited a museum, gallery or exhibition. The link between motivation and use is therefore clearly visible.
Conversely, almost three in ten people in this group did not report such a visit. The table does not record why: possible reasons range from length of stay and opening hours to choosing other forms of culture.
€4.20 is an average, not a museum ticket
All respondents spent an average of €140.20 per person per day. Of this, €4.20, or 3.0 per cent, went to the combined category of culture and entertainment.
That amount is neither the average museum admission price nor the spending of a museum visitor. The average includes guests who made no such expenditure, and the category covers much more than museums.
Culture visitors spend more, but the table does not explain why
Travellers with culture and art as their main motivation recorded average total daily spending of €208.60 in TOMAS. Spending on culture and entertainment was €9.20, or 4.5 per cent.
The difference is interesting, but it does not prove that culture alone causes the higher total expenditure. Accommodation category, destination, income, form of travel and the profile of the stay may also play a part.
Why culture still matters outside the main season
Eurostat reports especially strong seasonal concentration in Croatia in 2025: 55 per cent of tourist nights fell in July and August. January, February, March, November and December together accounted for less than five per cent.
Museums, heritage, events and urban attractions are not as directly dependent on bathing weather. They therefore fit the strategic aim of more year-round and regionally balanced tourism. The figures do not, however, promise that every cultural project will automatically create additional overnight stays.
What the study captures and what it does not
From June 2022 to June 2023, TOMAS surveyed 14,632 adult visitors in 148 destinations. Participants had to spend at least one night in commercial accommodation, and interviews were conducted face to face using a structured format.
The study is therefore broad but not unlimited. Day visitors, private stays outside commercial accommodation and later changes in behaviour are not automatically represented. Nor are 17.5 million arrivals and 90.5 million overnight stays from January to August 2026 the same measure – neither means 90.5 million individual tourists.
Evidence
Sources & date
Sources support the facts. Planning notes and recommendations are Golden Beach editorial assessments.
- TOMAS Hrvatska 2022/2023 – Stavovi i potrošnja turista u HrvatskojInstitut za turizam / Hrvatska turistička zajednica · 2023; geprüft 24. September 2026Methodik, Reisemotive, Aktivitäten, Zufriedenheit und durchschnittliche Tagesausgaben nach Motiven und Regionen
- Tourism statistics – seasonality at regional levelEurostat · Datenstand 2025; geprüft 24. September 2026Saisonkonzentration touristischer Übernachtungen in Kroatien
- Strategija razvoja održivog turizma do 2030. godineMinistarstvo turizma i sporta · geprüft 24. September 2026strategische Ziele eines ganzjährigen und regional ausgewogeneren Tourismus
- Unatoč brojnim izazovima još jedna rekordna turistička godinaMinistarstvo turizma i sporta · September 2026; geprüft 24. September 2026amtliche Trennung von Ankünften und Übernachtungen für Januar bis August 2026


